
I am a data analyst with a background in biological research, having worked in pharmaceutical and agricultural development laboratories. My curiosity in data grew as we collected data from experiments and I saw how a simple analysis can alter how we move forward in the formulation process.
During my CareerFoundry course, I became experienced in data cleaning and analyzing in Excel, SQL, and Python. My need to solve puzzles drives me to uncover facts in the data sets, and my organization and creative skills are conveyed through creating effective storylines in Tableau.
I am enthusiastic about new opportunities to enhance my skills.
Analytical Skills
Tools
Competencies
Objective
As an analyst for NYC department of transportation and the local police department, they want to understand the patterns in accidents throughout the 5 boroughs of NewYork. Our task is to perform an initial data and exploratory analysis of the primary causes and types of vehicles involved in accidents, along with where and when these accidents occur in order to derive insights and suggest strategies to better prepare each borough for these accidents.
Context
In order to prepare local emergency response for accidents that may occur in each borough, we want to interpret when and where the most dangerous vehicular accidents occur in NewYork.
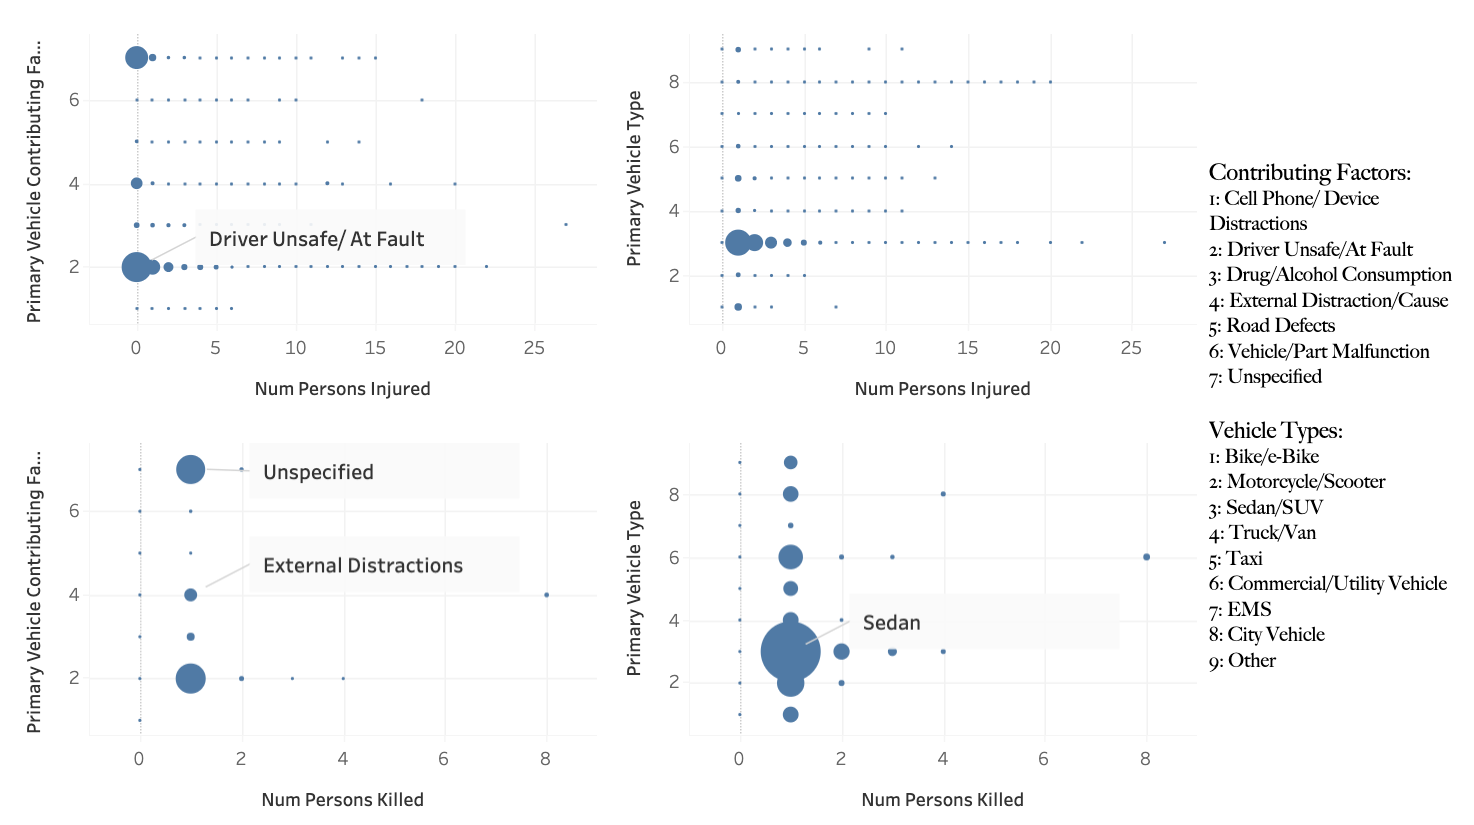
For the sake of exploration, we observed the relationships between the key contributing factors of the primary vehicles involved in accidents, what type of vehicle the primary vehicle was, and the number of people that were injured or killed in the incident.
The contributing factors of the primary vehicle involved in the accidents that lead to injuries or fatalities are most frequently 7(Unspecified), 2 (Driver at Fault), and 4 (External Distractions). The most common vehicle type of the primary vehicle in accidents that lead to injuries or fatalities is 3(Sedan).
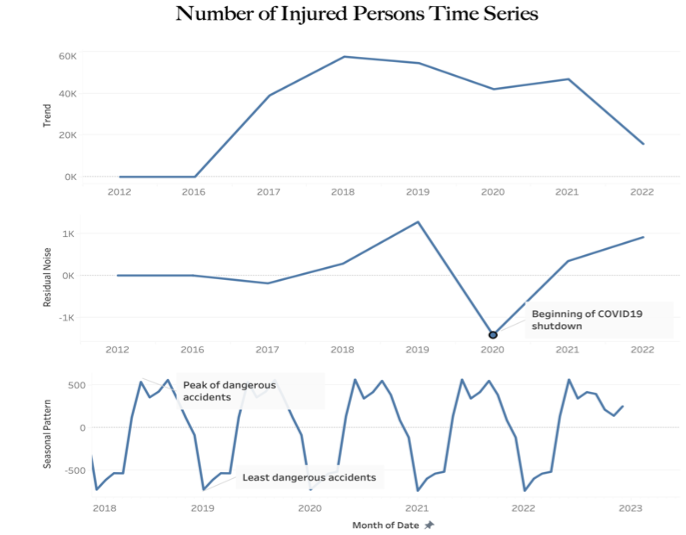
The number of people injured has decreased overall since 2018, with a large drop in 2020 due to COVID19 shutdown and not as many people being out on the roads. There is a seasonal pattern indicating a peak in dangerous accidents from June to September, and a low in January.
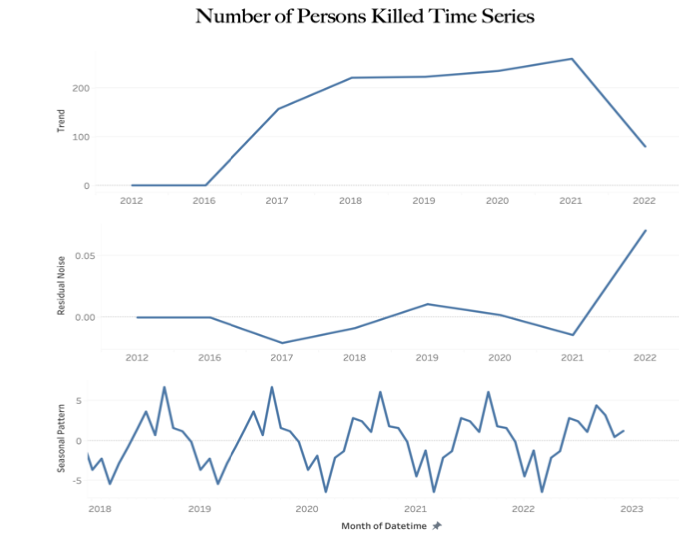
Like injuries, the number of people killed in accidents has decreased overall. The seasonal pattern indicates that a spike in fatal accidents occurs around September, and the least fatal accidents occur in March.
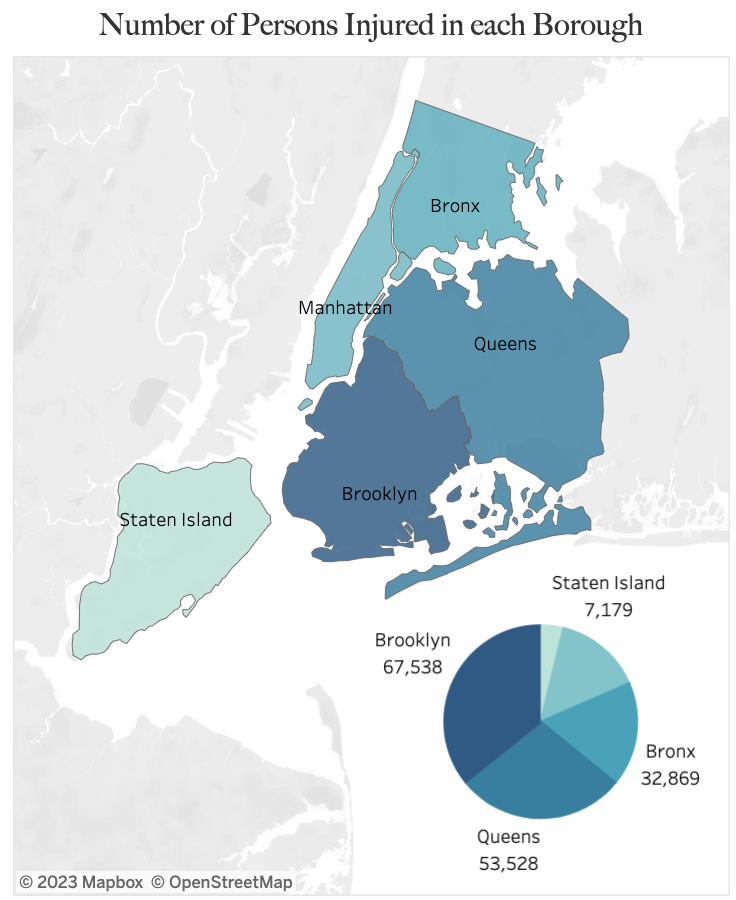
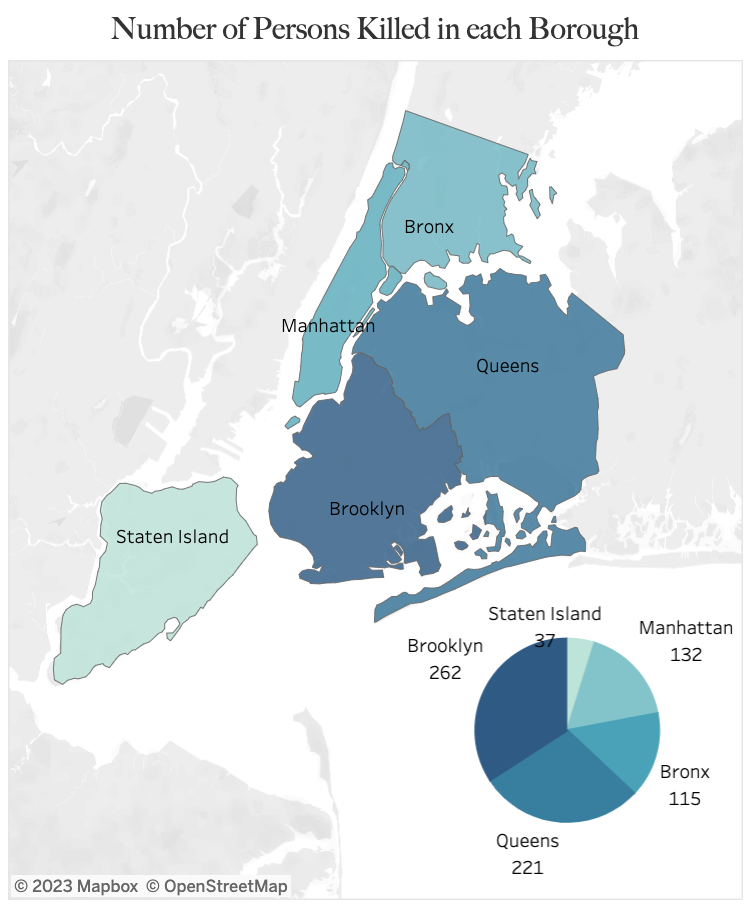
The darkest shade of blue indicates the boroughs with the highest rate of injury or deaths from an accident. Brooklyn has the highest rate of both accident injuries and deaths, followed by Queens. Brooklyn has the largest population and the second largest population density, followed then by Queens. When observing injuries and deaths proportionally to population density of each borough, Queens has 1.5% more injuries and deaths than Brooklyn.